
5
1
9780071441193


The Lean Six SIGMA Pocket Toolbook: A Quick Reference Guide to Nearly 100 Tools for Improving Quality, Speed, and Complexity / Edition 1 available in Paperback, eBook


The Lean Six SIGMA Pocket Toolbook: A Quick Reference Guide to Nearly 100 Tools for Improving Quality, Speed, and Complexity / Edition 1


- ISBN-10:
- 0071441190
- ISBN-13:
- 9780071441193
- Pub. Date:
- 09/22/2004
- Publisher:
- McGraw Hill LLC
- ISBN-10:
- 0071441190
- ISBN-13:
- 9780071441193
- Pub. Date:
- 09/22/2004
- Publisher:
- McGraw Hill LLC
The Lean Six SIGMA Pocket Toolbook: A Quick Reference Guide to Nearly 100 Tools for Improving Quality, Speed, and Complexity / Edition 1
$22.0
22.0
In Stock

Product Details
| ISBN-13: | 9780071441193 |
|---|---|
| Publisher: | McGraw Hill LLC |
| Publication date: | 09/22/2004 |
| Edition description: | List |
| Pages: | 288 |
| Sales rank: | 131,174 |
| Product dimensions: | 8.40(w) x 11.70(h) x 0.71(d) |
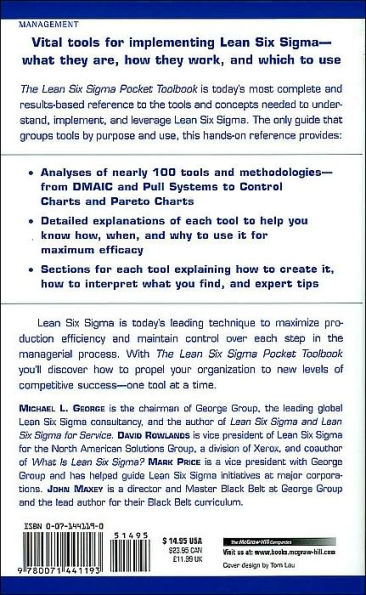
About the Author
From the B&N Reads Blog
Customer Reviews
Explore More Items


")


